How I spent my time in Spring 2022
At the end of each semester, I review how I spent my time that semester. I track my time in Toggl, and use the platform (free version) to analyze my time data.
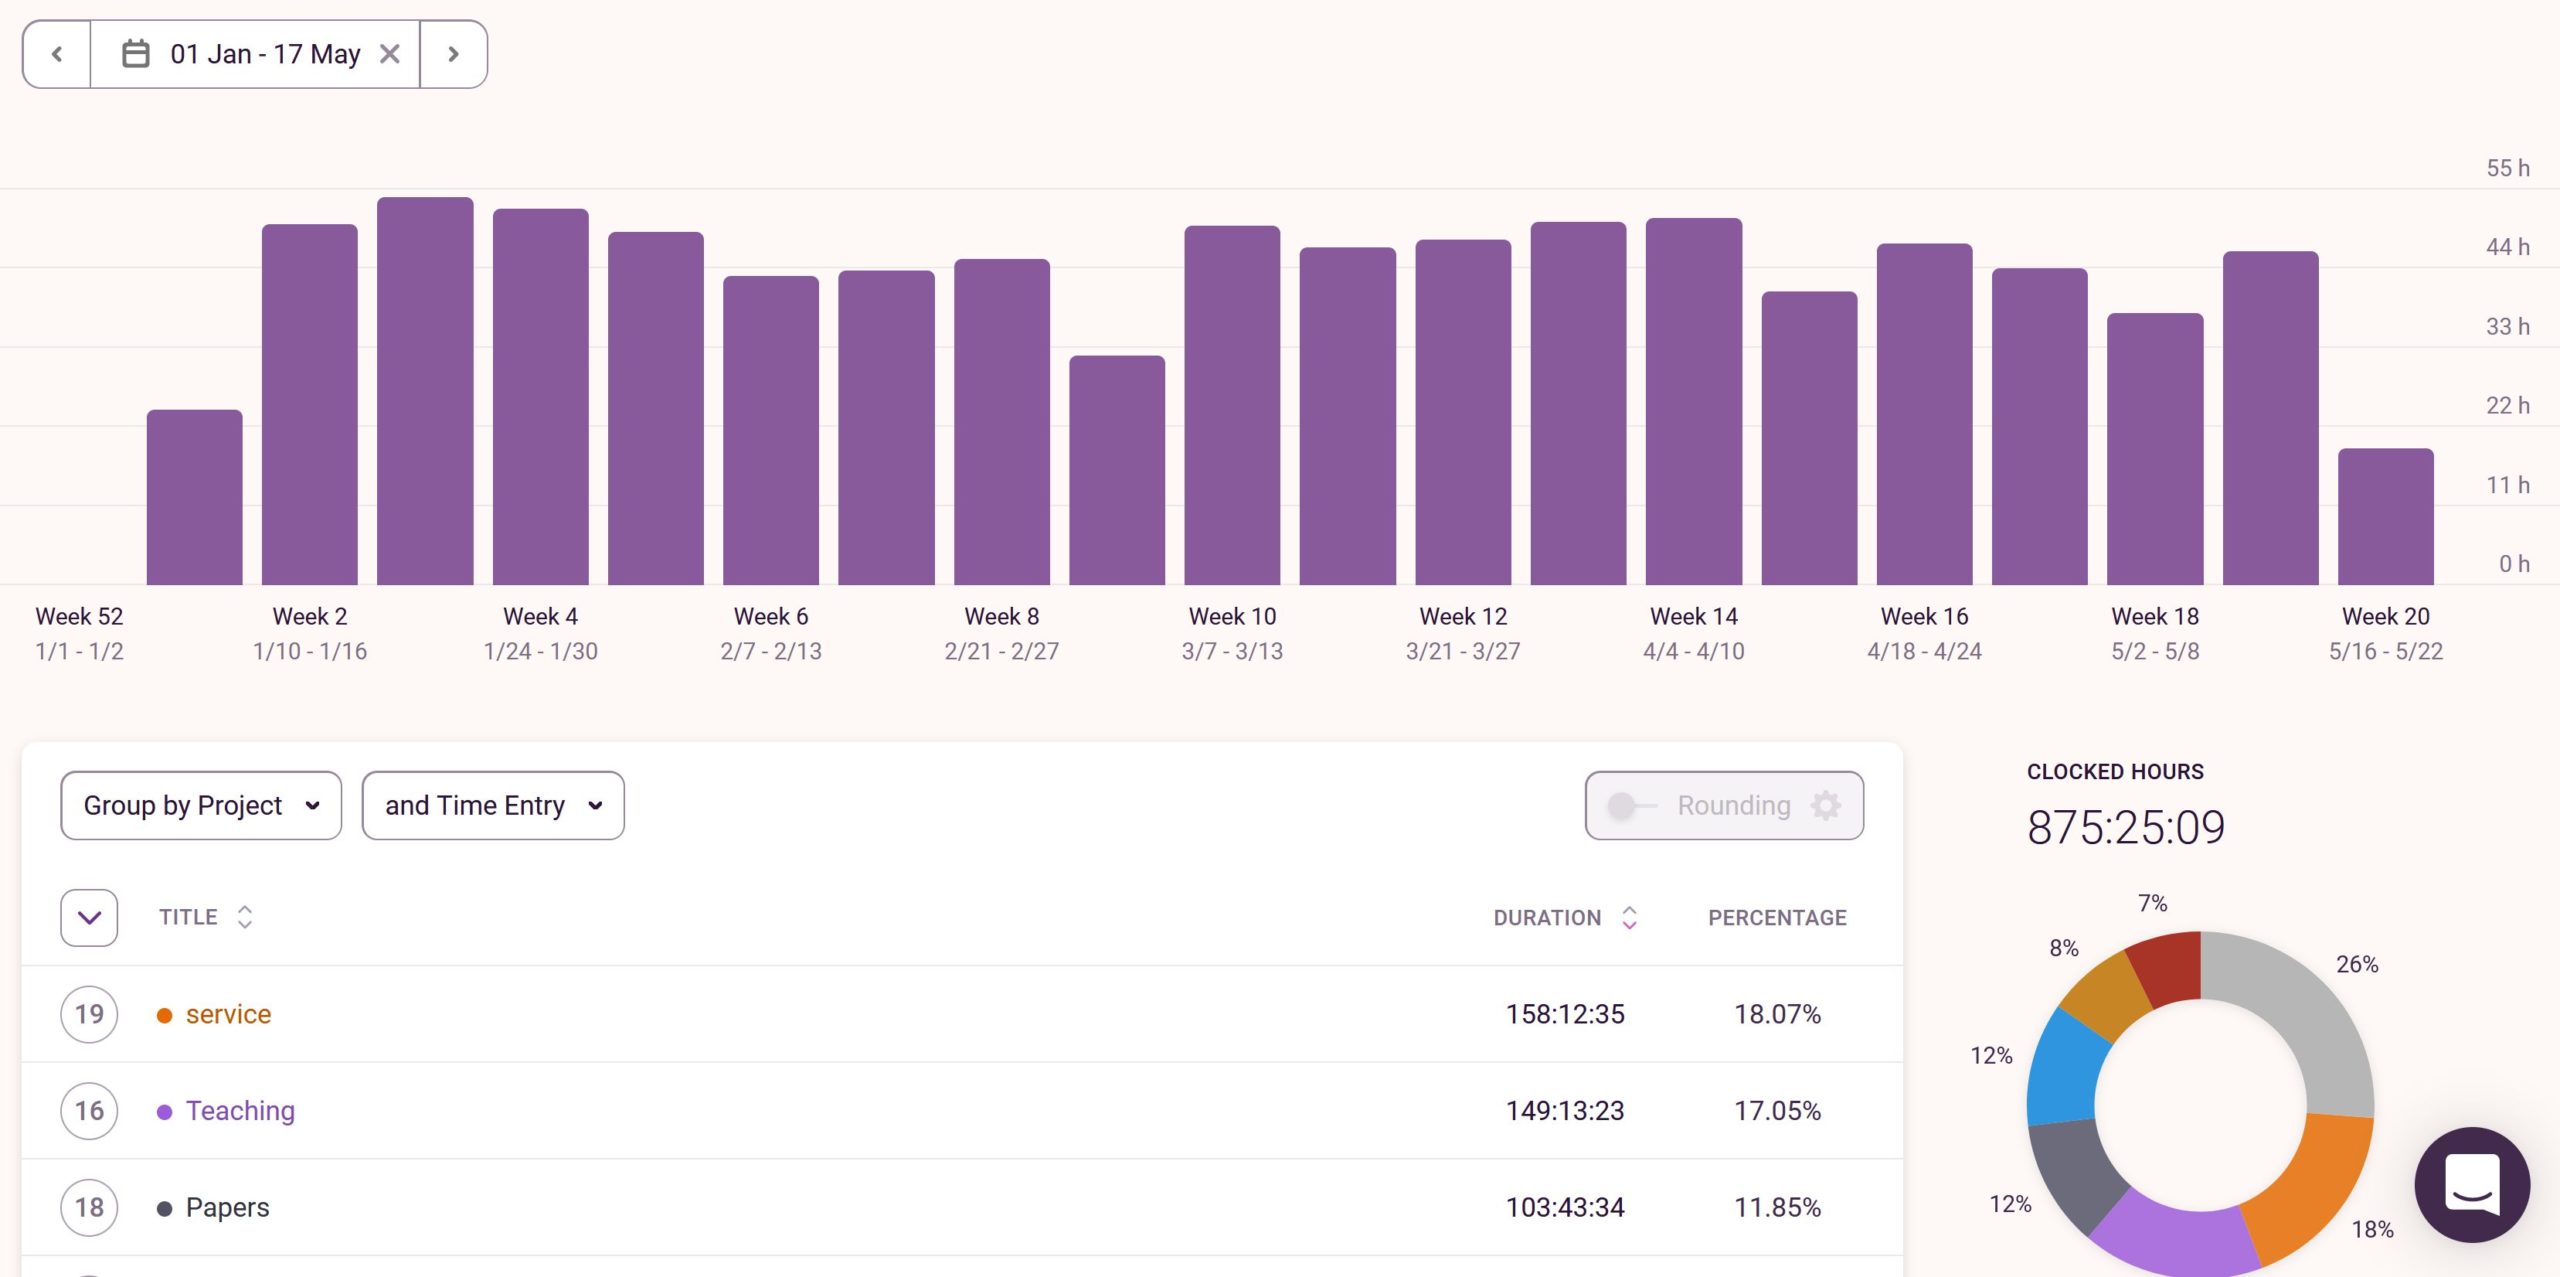
In Spring 2022, I’ve been doing better with my overwork tendencies. My workweeks were between 24 and 54 hours in length, and I averaged 46 hours per week. In that regard, I’m doing better than previous semesters – although I must say that with the loss of my mother and all the related administration, I’ve been occupied with other things (besides childcare).
I worked a total of 875 hours, and my time was spent in the following categories:
- Service: 18.07%
- Teaching: 17.05% + 4.29%
- Papers: 11.85%
- PhD project 1: 11.56%
- Blog 8.04%
- ACI Avances: 7.29%
- Research: 3.56%
- Admin: 3.26%
- PhD project 2: 3.19%
- Planning: 2.65%
- PhD project 3: 1.88%
- Email + admin: 1.25% (which is a general category I use for sorting email, not replying)
- Research collaboration: 1.17%
- Meetings: 0.98% + 0.85%
- PhD project 4: 0.74%
- Learning: 0.56%
- PhD Project 5: 0.47%
- Research proposals: 0.36%
- Consultancy: 0.35%
- PhD Project 6: 0.25%
- PhD project 7:0.14%
- Contacts: 0.05%
- Fatigue research: 0.01%
This has been a service-heavy semester, but within these technical committees I think we’ve achieved some good results and are working towards documents that hopefully will have an important impact. I’ve spent less time on my papers, and I foresee that I will continue to spend less time over the summer (when I will travel and will focus on building relationships and will have lots of meetings) and during the fall (when I’ll be teaching two courses, one of which is a completely new-to-me graduate level course).


